Work Payments Platform
One platform for every way you work
Payments
Flexible payment infrastructure for global teams
Gig Pay
Global gig payments, simplified
Global Payroll
Run payroll worldwide
Contractor Payments
Pay anyone, anywhere
Multi-Currency Wallet
Store, convert, and spend
Physical and Virtual Cards
Spend globally, anytime
Expenses Management
Approval, validation and payment
Dedicated Euro IBANs
Operate with your own dedicated EU IBAN
Operations
Supporting the work behind every payment
EOR (Employer of Record)
Your global team, locally employed
Entity Management
Set up and manage entities
HR, Payroll & Benefits
Manage all admin tasks from one place
Global Employee Benefits
Premium benefits for your global team
Relocation and Visa
Relocate your team anywhere
Employment Contracts
Localised employment contracts
Absence Management
Track, approve, and manage time off
Going Global in 2026?
The Global Expansion Report
A Benchmark of Cost, Risk, and Complexity Across 19 Markets
Download the report


We help companies hire globally. Not a recruitment agency, not a job board.
Introduction
Global expansion is a common milestone in many companies’ growth journeys - but the reality is far more complex than it seems. To bring more clarity to what it actually takes to set up and operate abroad, Native Teams has released its Global Expansion Report, serving as the first industry benchmark of the true cost, risk, and operational complexity of global expansion.
Expansion insights from
3000+
internationally active companies
Verified data from
17
legal, accounting, and compliance partners
A proprietary survey of
100+
founders, startup leaders across SaaS, fintech and more
Research across
19
jurisdictions around the world
The report was conducted during Web Summit 2025 and in partnership with Swiss Entrepreneurship Program (Swiss EP), Startup Club Skopje, Fil Rouge Capital, Eleven VC, and MFG Invest.


Key finding:
Expanding and operating into a single market costs approximately €15,000 per year, and the economics shift dramatically once a team grows beyond 4-10 employees, where owning infrastructure becomes more cost-effective than relying on rented compliance.
Report overview
The benchmark highlights the most central themes that shape how companies are expanding in 2025.
Focus regions
Europe and North America remain the top regions, while secondary markets like APAC, LATAM, and MENA are also gaining attention.
Operational complexity matters
Digitalisation gaps and manual processes in some markets add time and administrative effort, making expansion more complex than many founders expect.
The scaling tipping point
The data provides a framework, highlighting the point at which establishing own infrastructure becomes smarter than relying on rented compliance.
Expansion priorities, operational complexity, and cost
Global expansion is all about balancing opportunities, operational complexities, and costs. The report highlights where founders are currently focusing, the practical barriers they face, and the real financial investment required to establish a presence abroad.
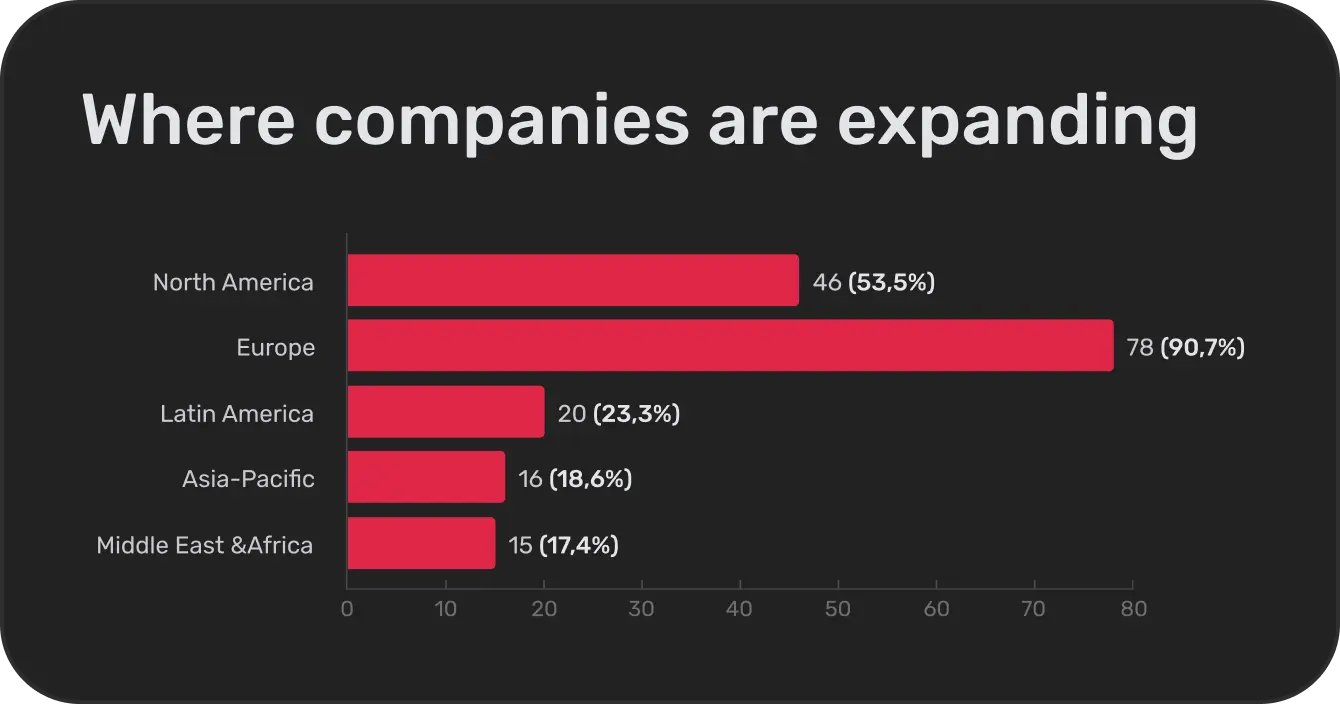
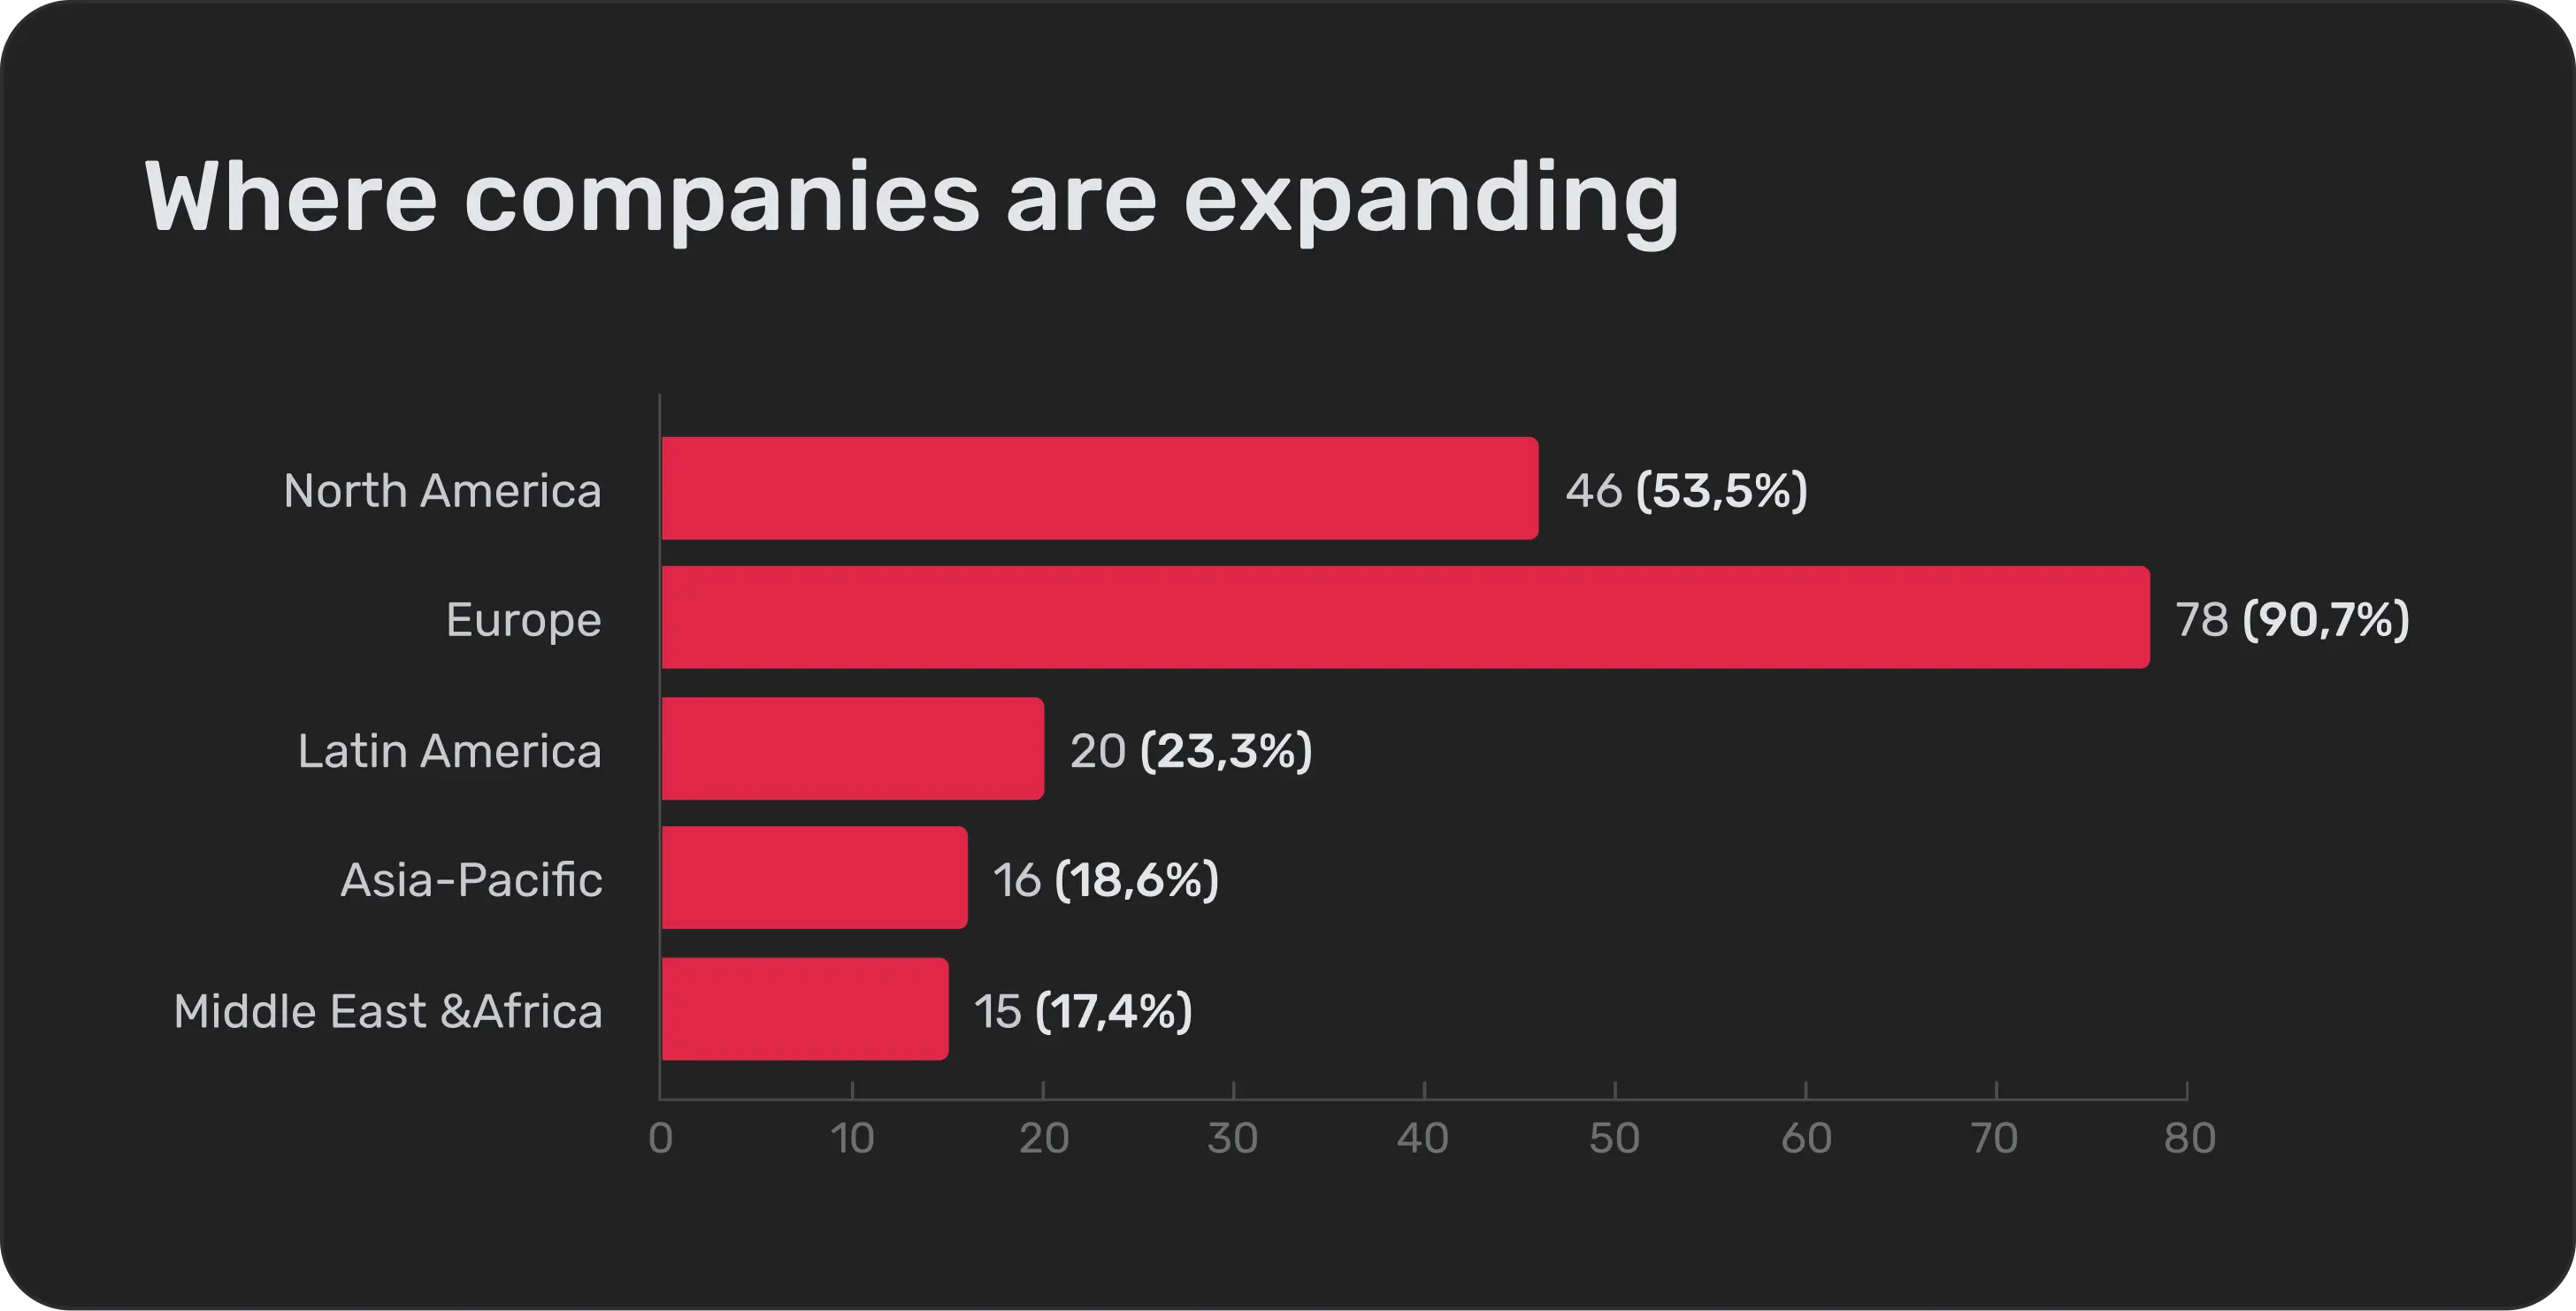
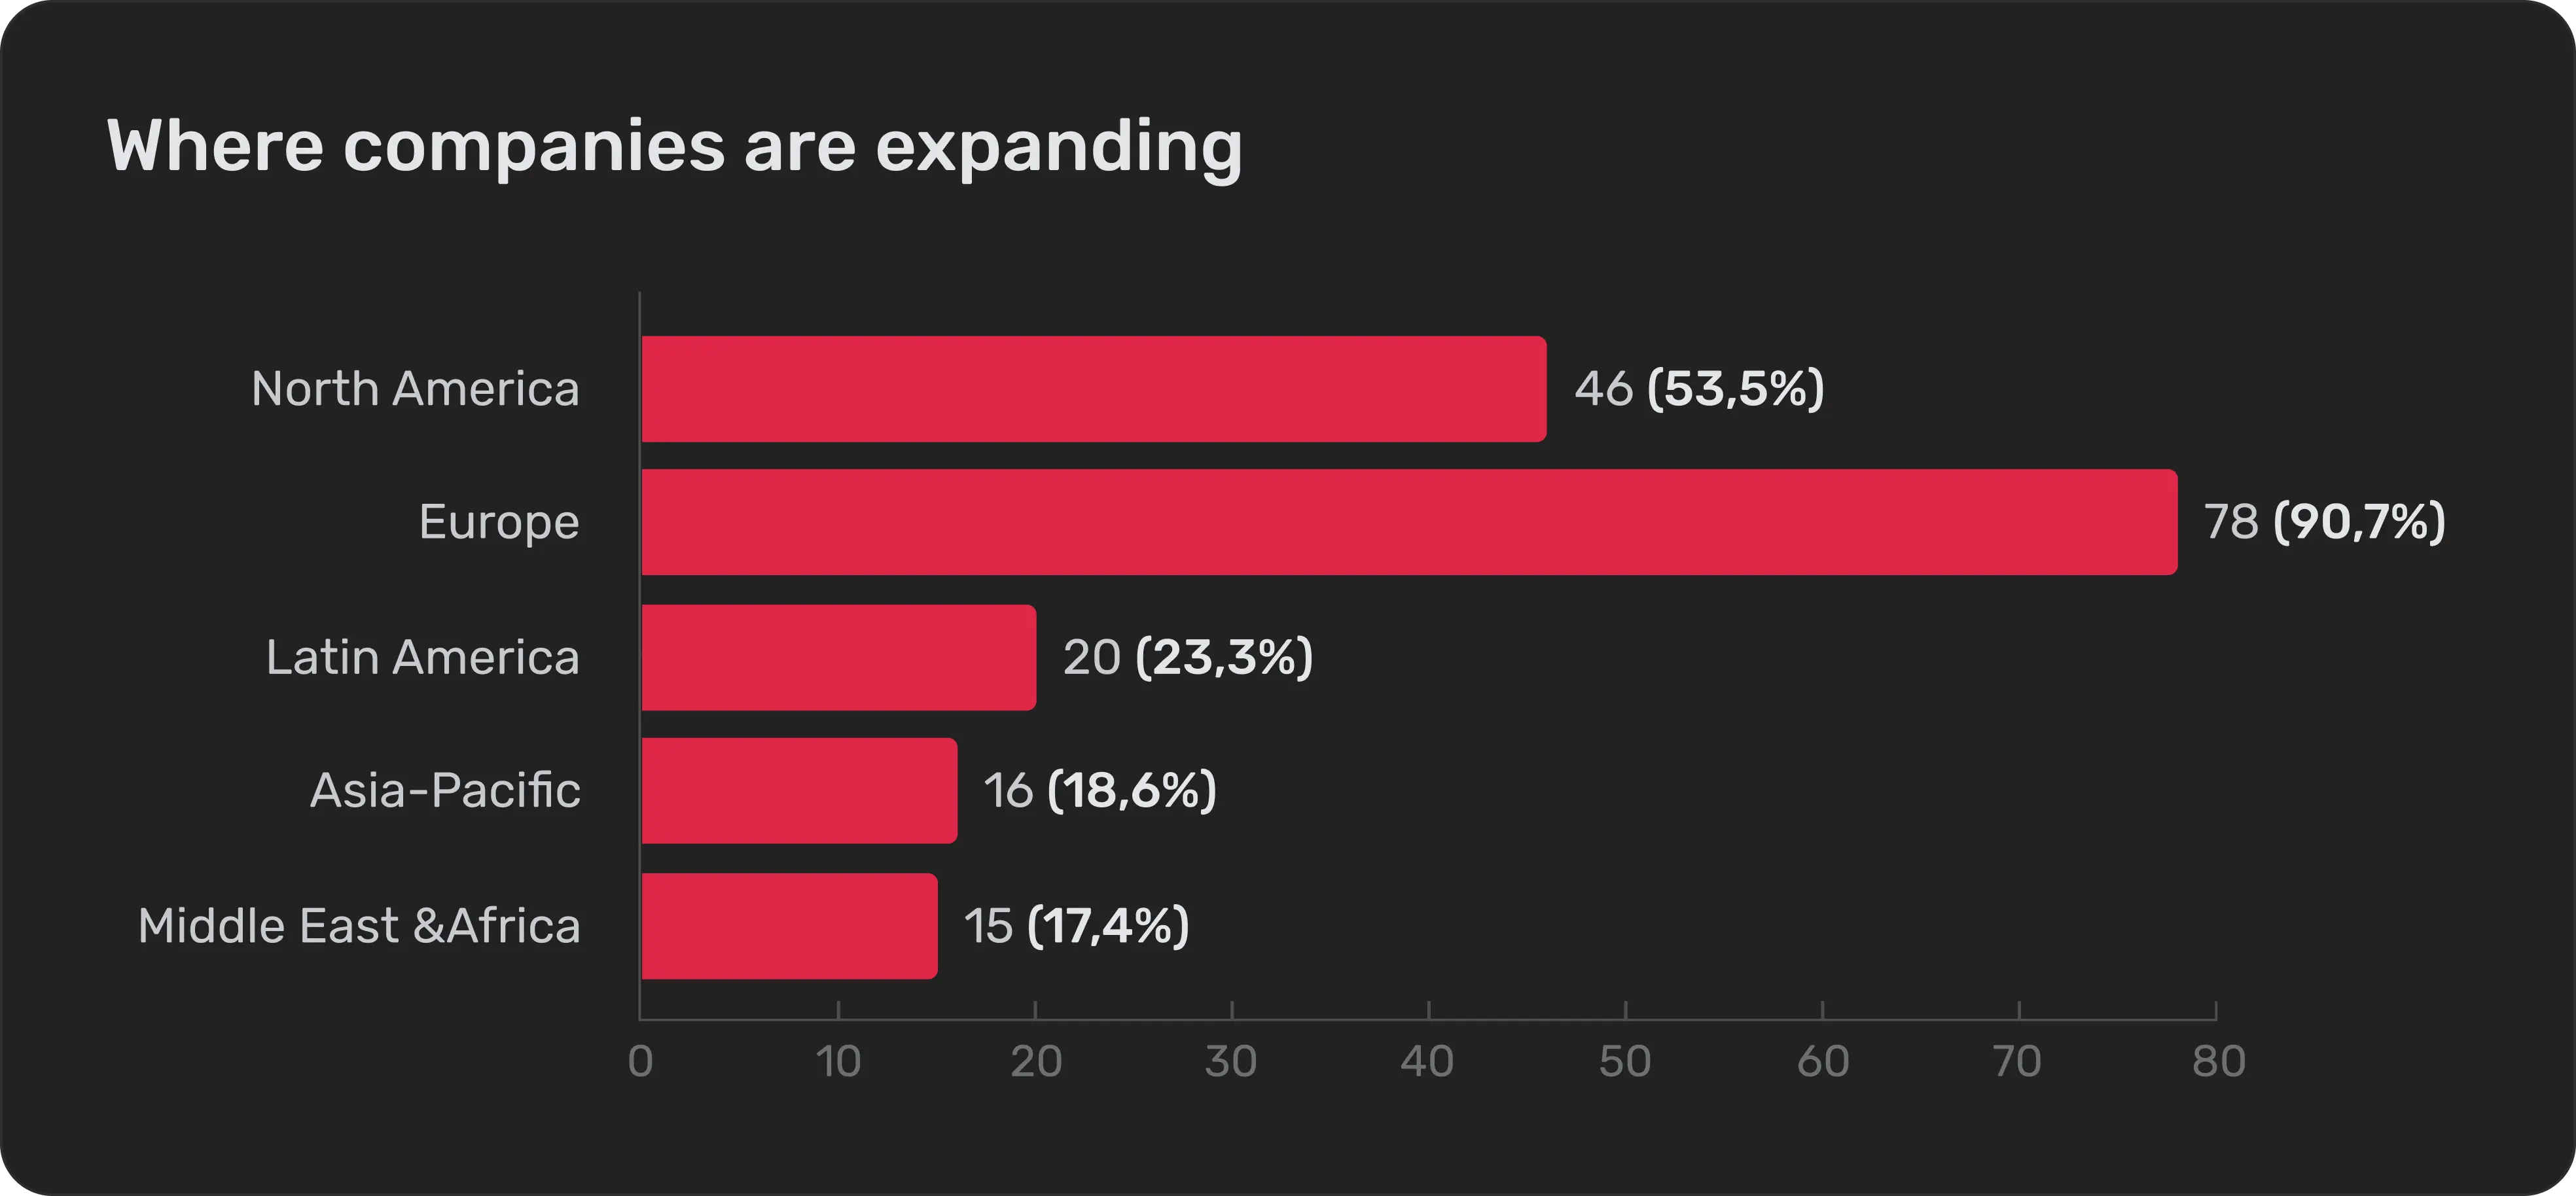
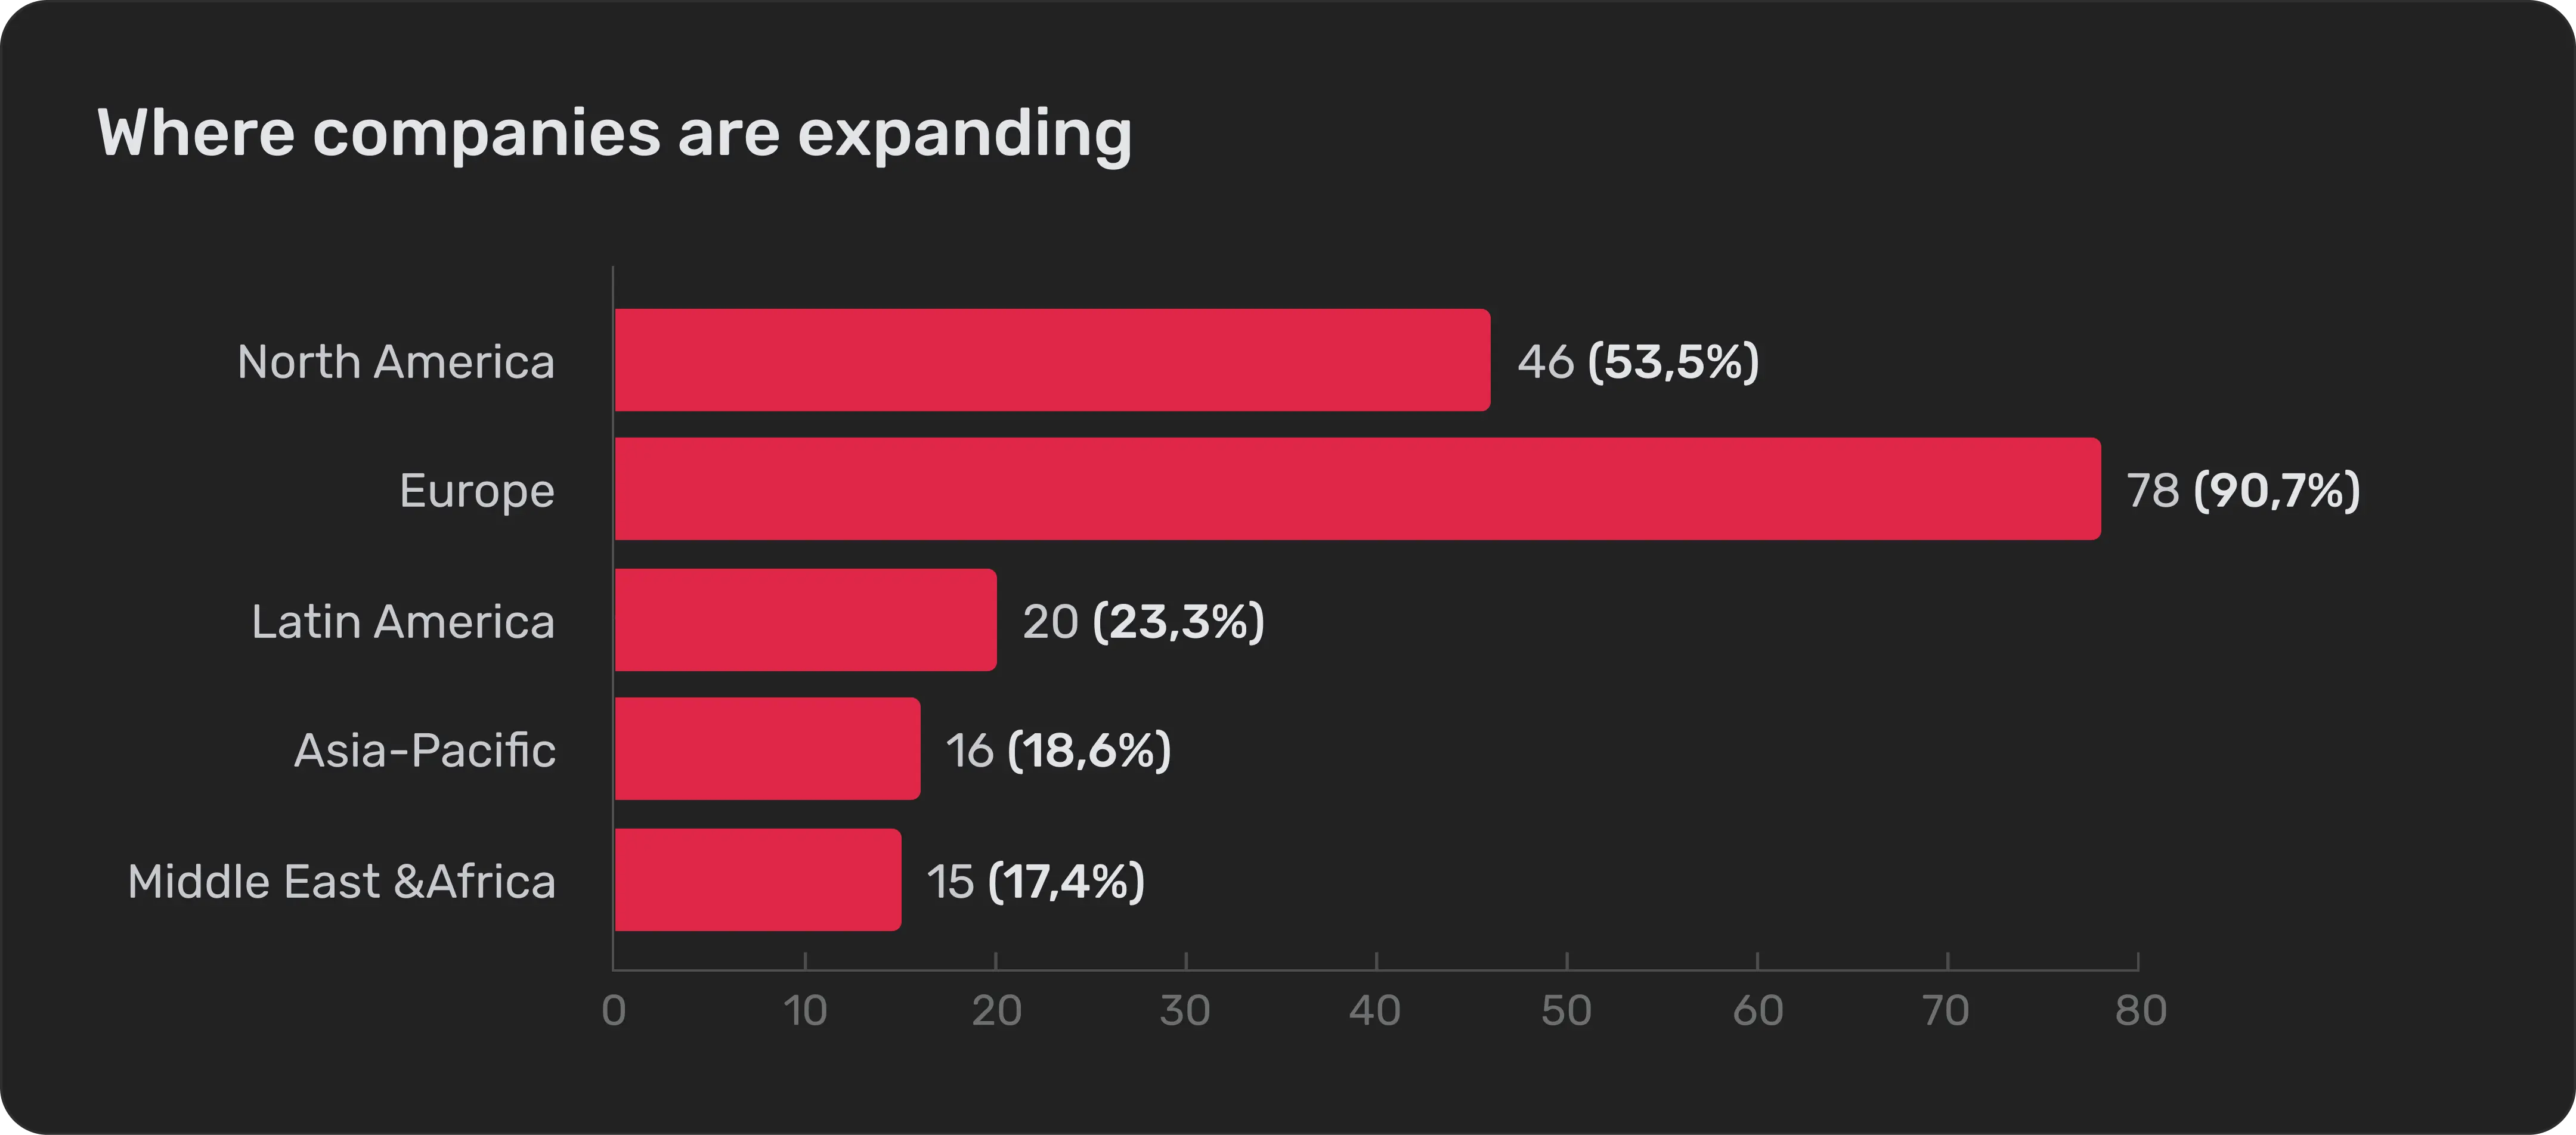
Europe and North America remain the top regions for founders planning global growth over the next 12-24 months.
Countries such as the UK, Portugal, Spain, Germany, Austria, Switzerland, and the United States offer regulatory familiarity and favourable market sizes, languages, and networks, which make them attractive first choices for scaling teams.
Secondary markets, including APAC, Latin America, the Middle East, and Africa, are increasingly considered once companies validate product-market fit or secure additional funding.


Central and Eastern Europe has proven talent that knows how to do more with less. LATAM is another strong region, supported by a fast-growing fintech ecosystem and good time zone alignment with the US. Both regions deliver high performance but still do not receive the attention they deserve.
-Simeon Iliev, Chief Opportunity Navigator at MFG Invest
Operational barriers and complexity
Despite the global shift towards remote work, many markets still rely on manual processes for incorporation and hiring.
The report assigns complexity scores on a scale of 1 to 5, with 1 being very easy and 5 being very hard.
Digitalised markets allow faster hiring and incorporation with less administrative overhead. Manual markets still require in-person notarisation, share capital deposits, and local bank verification, which delays processes and adds costs.
The cost of global expansion
Expanding into a new market comes with upfront and ongoing financial commitment.
Companies spend around €15,000 per market per year to set up and operate a local entity.
Setup cost
€7,300
including legal filings, registration, and initial administrative requirements.
Annual maintenance
€7,700
covering ongoing compliance, payroll setup, tax filings, and regulatory obligations.
Incorporation timeline
15-23
business days depending on market complexity and manual requirements.
Additional liabilities
+
local banking, employee benefits, and administrative overhead.
Understanding these costs is essential for founders to plan expansion strategically, weigh the benefits of Employer of Record (EOR) vs owning infrastructure, and avoid surprises that could slow growth or inflate budgets.
The scaling tipping point
One of the most significant insights from the Global Expansion Report is the economic tipping point for global expansion.
Team size threshold: 3-7 employees per market (or 4-10 when factoring a recommended
50% cost buffer).

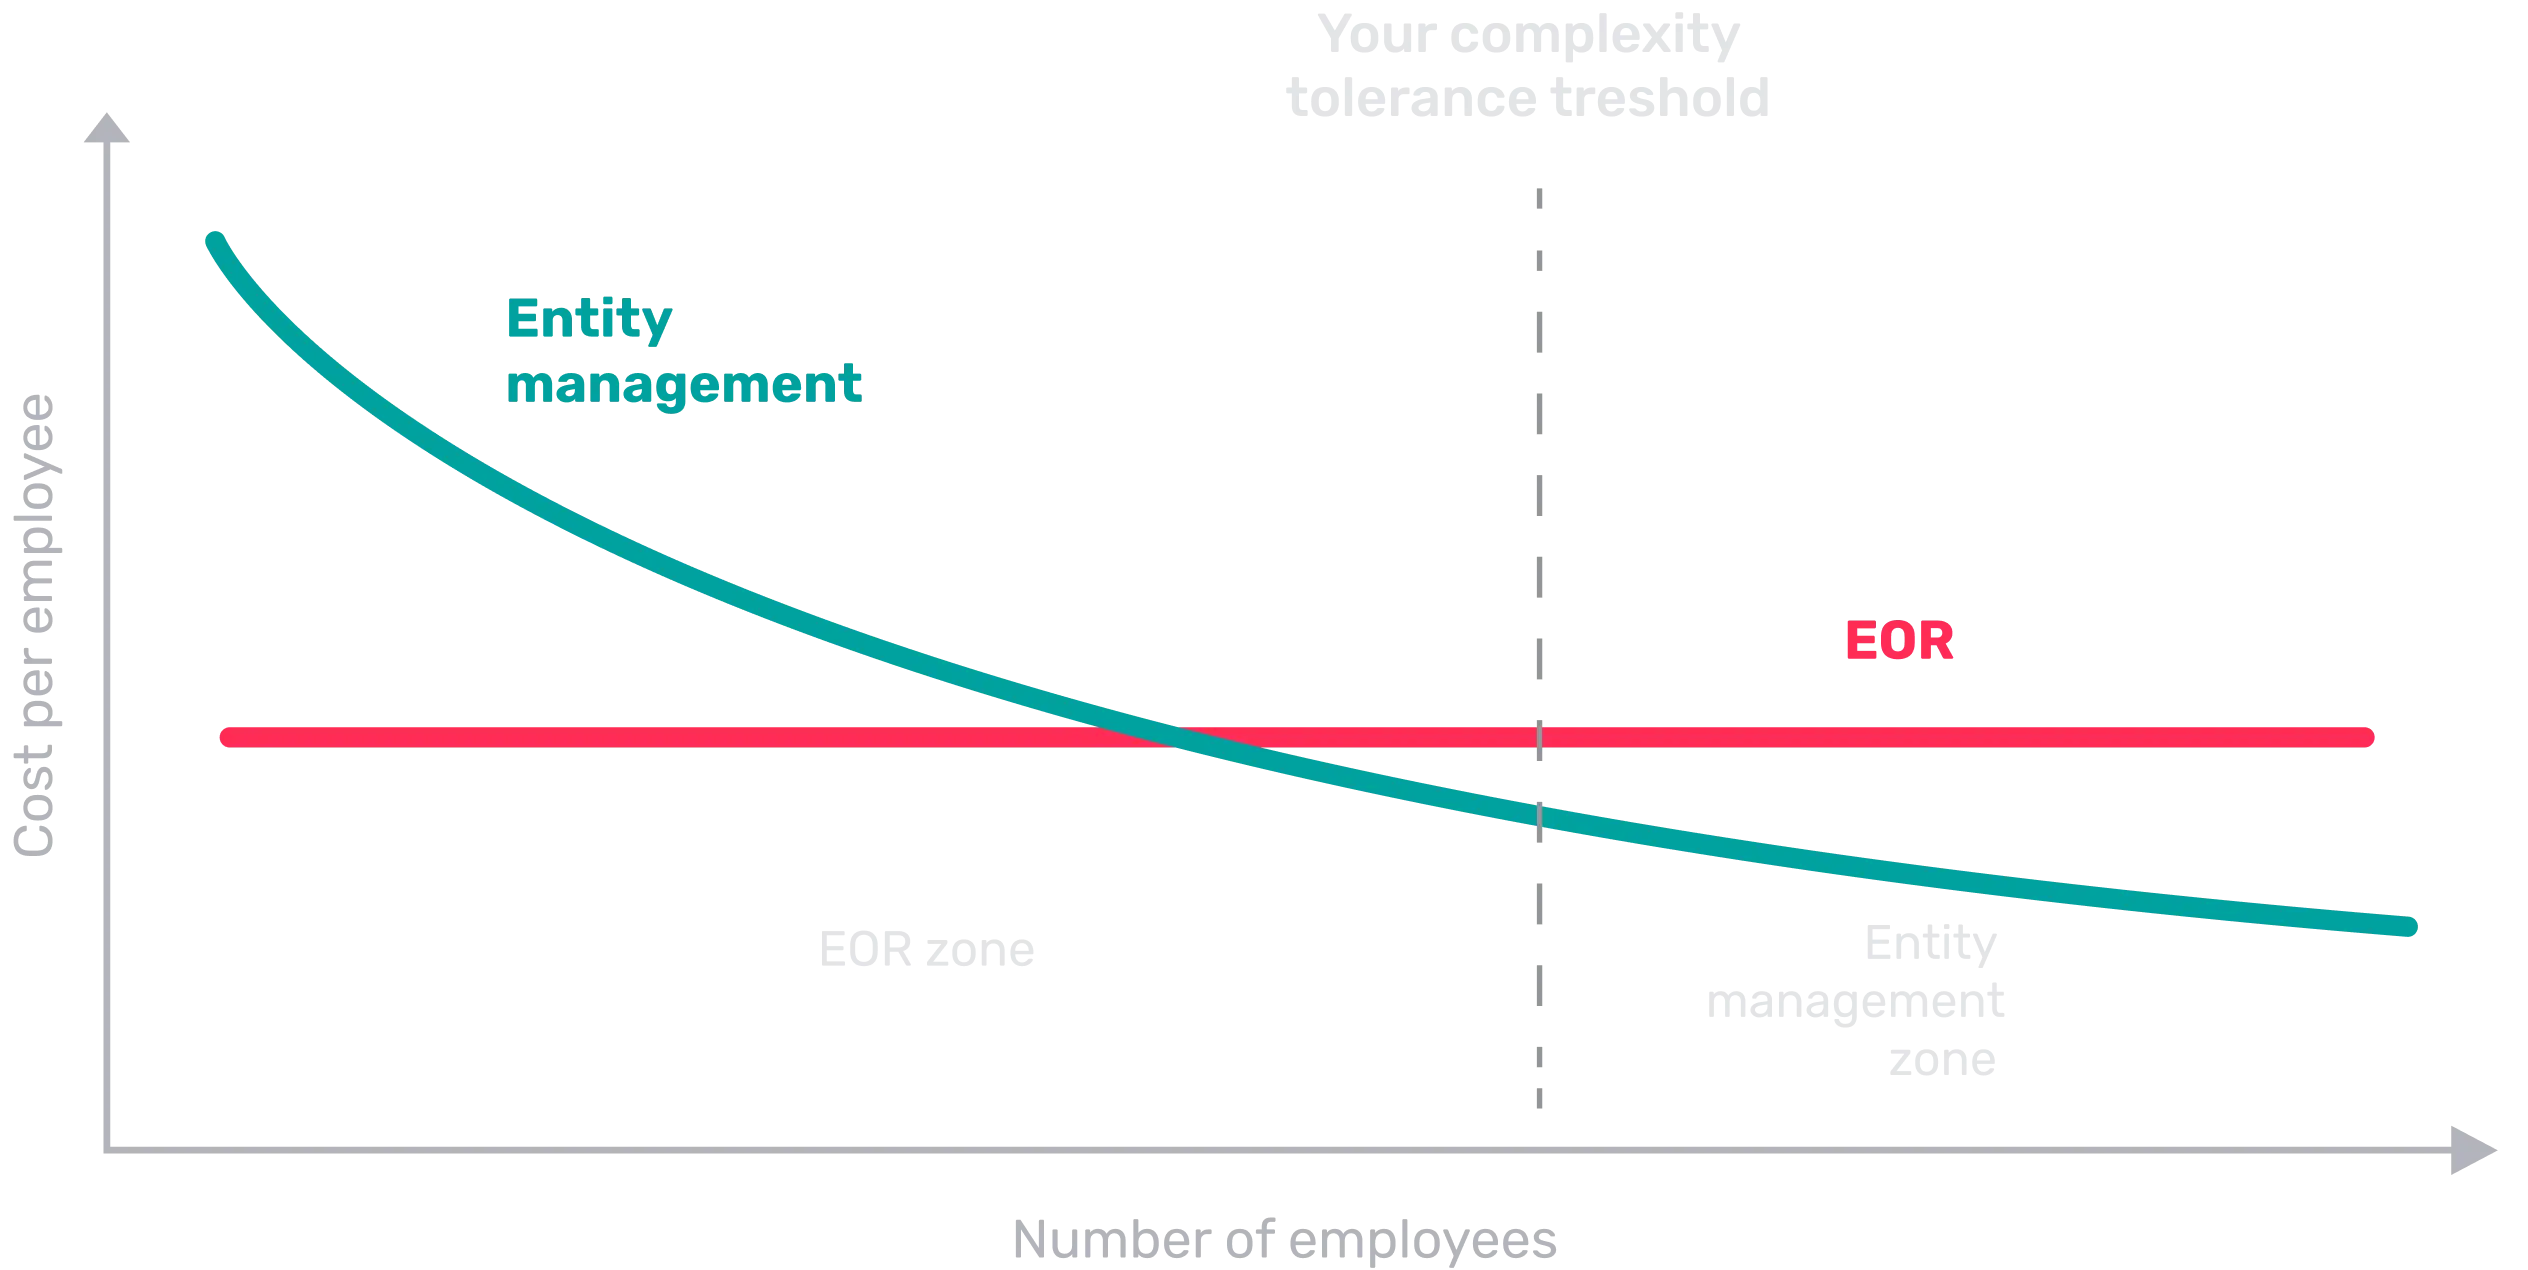

At this stage, the total cost of using EOR services often meets or exceeds the annual cost of owning and
operating an entity (~€15,000 per year).
When to use EOR
For early market entry or testing, EOR provides flexibility, speed, and low upfront investment, which is perfect for companies that want to expand without committing to full infrastructure.
When to own an entity
As teams grow and surpass country-specific tipping points, owning local infrastructure delivers greater cost predictability, operational control, and compliance stability.
Hybrid models
Many founders start with EOR and gradually transition to owning entities as their teams and operational needs scale, blending both models to balance speed and efficiency.


Our findings clearly reveal a tipping point in global expansion strategy. While flexible hiring models such as Employer of Record, contractor arrangements, and hybrid setups, remain the most efficient pathway for early market entry, the economics shift once a company scales beyond a small team. When a business reaches roughly 4 to 10 employees per market, the annual cost of EOR begins to mirror, or even surpass, the investment required to establish and maintain a local entity. At this stage, owning infrastructure not only delivers stronger cost predictability but also greater control over compliance, payroll, and long-term operational growth.
- Jack Thorogood, Founder & CEO of Native Teams
Explore the full Global Expansion Report
The Global Expansion Report provides a detailed, data-driven view of cost, risk, and operational complexity across 19 markets. Learn exactly how much it costs to enter each market, understand complexity scores, and discover country-specific tipping point frameworks to determine which model makes more sense at your current global growth stage.


Download the Global Expansion Report
Fill out the form and access the full report now!